Aquasana’s 3rd Annual Water Quality Survey Provides Insight on U.S. Adults’ Knowledge and Concern About Drinking Water

In honor of National Water Quality Month each August, we survey U.S. adults about their drinking water concerns with the ultimate goal of spreading awareness about water quality issues and to help people to find solutions they can trust.

By: Rachel Carollo

In honor of National Water Quality Month each August, Aquasana conducts a survey to gauge U.S. adults’ concern about the quality of their drinking water. Our ultimate goal is to spread awareness about water quality issues and help people to find water treatment solutions they can trust. 

For our 3rd annual report (also check out our 2019 and 2020 results), we surveyed 2,143 U.S. adults between the ages of 18-79. The research was conducted throughout March 2021. 

Of particular interest to us this year was to understand what impact the COVID-19 pandemic has had on people’s thoughts and behaviors regarding their drinking water and water quality concerns. Overall, the 2021 Aquasana National Water Quality Survey set out to provide insights into the following:

  1. How the COVID-19 pandemic affected Americans’ concerns and behaviors specific to water quality
  2. Top water contaminant concerns in 2021 
  3. Behavior gaps between Americans’ contaminant concerns and the actions they take to mitigate those concerns

Read on to see our findings on these subjects and also learn how you can best address your own water quality issues.


The COVID-19 Pandemic’s Impact on Behavior and Water Quality Concerns in America

COVID-19, which was declared a pandemic by the CDC in March 2020, has had a dramatic impact on Americans’ lifestyles and behaviors, including changes in concern about the quality of tap water in their homes. 

In reviewing year-over-year data, it’s important to note our 2020 National Water Quality Survey data was collected in February 2020 before the pandemic had a widespread impact in the U.S., so in comparing 2021 results with 2020 results, we are looking at pre- and post-pandemic changes.

This year’s survey found that 87% of Americans spent more time at home because of the pandemic, and 36% of those people are now more concerned about the quality of their tap water than they were prior to the pandemic.

Groups that were particularly concerned about the quality of their tap water include:


  • Parents: Parents are twice as likely as U.S. adults who don’t have children to say spending more time at home due to the pandemic has made them more concerned about the quality of their tap water (52% vs. 26%).
  • Millennials: Millennials are the age group most likely (22% more likely) to say spending more time at home because of the pandemic has made them more concerned about the quality of their tap water (39% vs. 32%).
  • Married People: Married people are 43% more likely to say spending more time at home because of the pandemic has made them more concerned about the quality of their tap water (43% vs. 30%).
  • Urbanites: People who live in urban areas are most likely (21% more likely) to say spending more time at home because of COVID-19 has made them more concerned about the quality of their tap water (40% vs. 33% of rural and suburban residents combined).

Another interesting change we found in U.S. behavior regarding water consumption is that 30% of Americans said they increased the amount of bottled water they purchased during the COVID-19 pandemic. Of the group of Americans who purchased more bottled water:

  • 36% did so because they believe bottled water is safer than tap water
  • 35% did so because bottled water is convenient 
  • 26% did so because they wanted a backup water supply
  • 3% said “other” 

These statistics show how important it is to continue to educate people about the lack of regulation in the bottled water industry. The FDA does not require bottled water companies to disclose where the water came from, how it has been treated, or which contaminants it still contains.

To learn more about how bottled water compares to filtered water, check out the Environmental Work Group's (EWG) article, “The Top 5 Reasons To Choose Filters Over Bottled Water” in which they reveal the contaminants they found in popular brands of bottled water including industrial chemicals, bacteria, and more.


Top Water Contaminant Concerns in 2021 

We found the pandemic had an impact on what people identified as their top water contaminant concern. While the top five concerns remained in the same order from last year, we saw notable year-over-year shifts in the individual percentages. 

While lead remained the top concern in 2021 with 29% of the vote, it was actually down from 33% last year. Meanwhile, the second-highest concern in 2021 was bacteria, cysts, and viruses which accounted for 24% of the vote, which is up from 19% last year. 

Next up was chlorine & chloramines at 17% (up from 14% in 2020), followed by herbicides and pesticides at 12% (down from 13% last year). Closing out this top five was fluoride, which accounted for 7% of the vote and was the only contaminant to stay at the same level year-over-year. Outside of the top five concerns, we saw PFOA/PFOS and “other” contaminants move up while VOCs and pharmaceuticals moved down year-over-year.

View the graph to see the top water contaminant concerns in 2021.


The COVID effect and year-over-year changes by age and geography

As noted earlier, the largest change regarding people’s top water quality concern was the +26% year-over-year increase (from 19% to 24%) for bacteria, cysts, and viruses. In terms of demographics, the groups that saw the largest jump in rating bacteria, cysts, and viruses as their top water contaminant concern were older Americans and people living in the Southern U.S. Gen X saw a +50% year-over-year increase (18% to 27%) and Baby Boomers saw a +47% year-over-year increase (19% to 28%). Furthermore, people in the South saw a +50% year-over-year increase from 20% in 2020 to 30% in 2021. We speculate this is linked to the pandemic, as the spread of COVID-19 has made people more concerned about the potential for viruses to spread through water supplies.

In addition to increased concern for bacteria, cysts, and viruses; we also found a +21% year-over-year jump in people who rated chlorine and chloramines as their top water contaminant concern. Groups that saw the largest year-over-year increase in rating chlorine and chloramines as their top water quality concern include Millennials who went up +38% year-over-year (13% to 18%) and Northeasterners with a +42% year-over-year rise (12% to 17%).


Although only 4% of people selected PFOA/PFOS as their number one water contaminant concern in 2021, awareness of the contaminant has consistently increased over the past three years and is nearly double what it was in 2019. As of 2021, one-third of Americans (33%) are at least somewhat familiar with PFOA/PFOS as it relates to water, which is up +27% year-over-year. This is also an +83% increase in the percentage of people who say they are familiar with PFOA/PFOS compared to 2019, up from 18% in 2019 to 33% in 2021.

Millennials are 67% more likely to select PFOA/PFOS as their top water contaminant concern compared to other age cohorts. This lines up with our data from last year, in which Millennials were 100% more likely than other age groups to select PFOA/PFOS as their top water contaminant concern. 

For reference, here are the segments that saw the largest year-over-year increase in familiarity with PFOA/PFOS:

  • Gen Xers +35% year-over-year (20% vs. 27%)
  • Women +32% year-over-year (22% vs. 29%)
  • Southerners +30% year-over-year (27% vs. 35%)
  • Parents +34% year-over-year (35% vs. 47%)
  • Additionally, nearly half of parents (47%) are familiar with PFOA/PFOS as it relates to water, and parents are 96% more likely to be familiar with PFOA/PFOS (47% vs. 24%)


The increased awareness is likely tied to several factors. Recent films like Dark Waters and The Devil We Know have increased mainstream media coverage of the contaminants. Additionally, these “forever chemicals” recently made national news when rain that fell in Ohio contained a surprisingly high amount of toxic PFAS.

PFOA/PFOS has also been a hot topic in the political circuit following a health advisory released by the EPA in 2016 and an action plan unveiled in 2019 and updated in 2020. Furthermore, in February 2021 the EPA re-proposed a rule to collect data on 29 PFAS chemicals in drinking water, and the agency took steps to develop enforceable drinking water standards. These events and others have likely contributed to the increased awareness around PFOA/PFOS in recent years.

Behavior Gaps Between Top Water Contaminant Concerns and Most Commonly Used Water Filters 

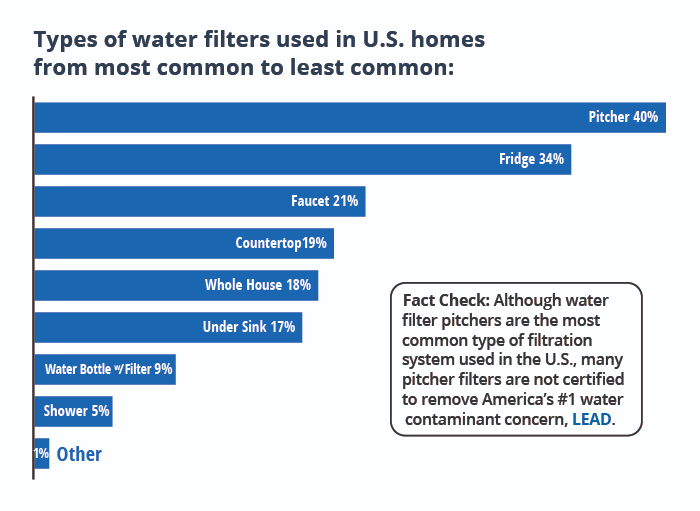
In line with our findings from last year, we found nearly three-quarters (74%) of Americans filter their water at home, with 40% of respondents saying they use a pitcher water filter. This is striking, considering most pitcher filters aren’t certified to remove the top contaminant concerns, such as lead. The same is also true for the next most popular type of water filter: refrigerator filters, which account for 34% of usage.

We found that although pitchers filters are the most popular type of water filter, only 12% of people believe they are the most trustworthy source of drinking water. Trust is even lower for refrigerator water filters, where only 4% of individuals believe they are the most trustworthy source of drinking water. This interestingly shows that the most commonly used water filters aren’t the most trusted sources of clean drinking water.

So what are the most trusted sources of drinking water? We asked people this question and compared the results to our findings from 2020 to see how behaviors have changed in the past year.

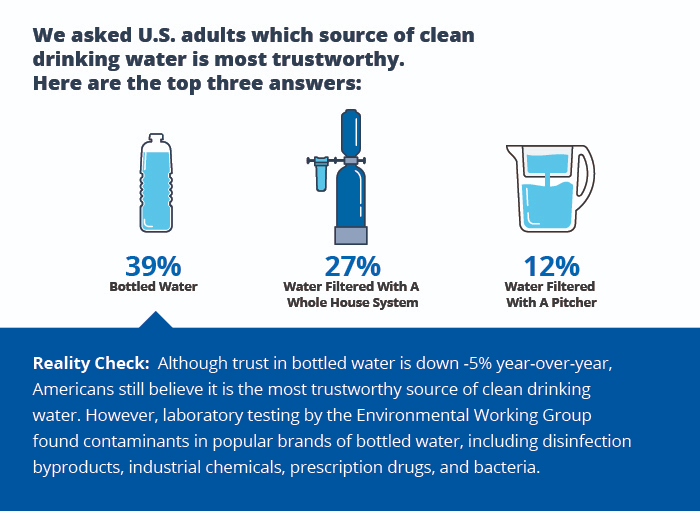
The most trusted source of drinking water remains bottled water with 39% of the vote, though the number of people who identified it as such is down -5% year-over-year from 41% in 2020. Decreased trust in bottled water may be linked to increased awareness that bottled water is not regulated by the FDA, unlike tap water which has federal drinking water standards for contaminants. In fact, a study by the Environmental Working Group found 38 contaminants in water bottles from 10 major brands including instances where contaminant levels exceeded legal limits.

The next most trusted source of drinking water was whole house filters, which is down -7% year-over-year from 29% in 2020 to 27% in 2021. Although usage of whole house filters is much lower compared to water filter pitchers, trust is higher and for good reason. Whole house water filters are one of the most effective ways to get clean, healthy drinking water throughout your entire home. However, before buying any filter you should always check to see if it’s been tested and certified by an independent third party such as NSF and IAPMO. All Aquasana water filters have been tested and certified, and you can even filter our product catalog by certifications and specific contaminants you’d like to filter.

Key Findings 

To summarize, in support of National Water Quality Month we set out to gain insight into several issues regarding water quality. 

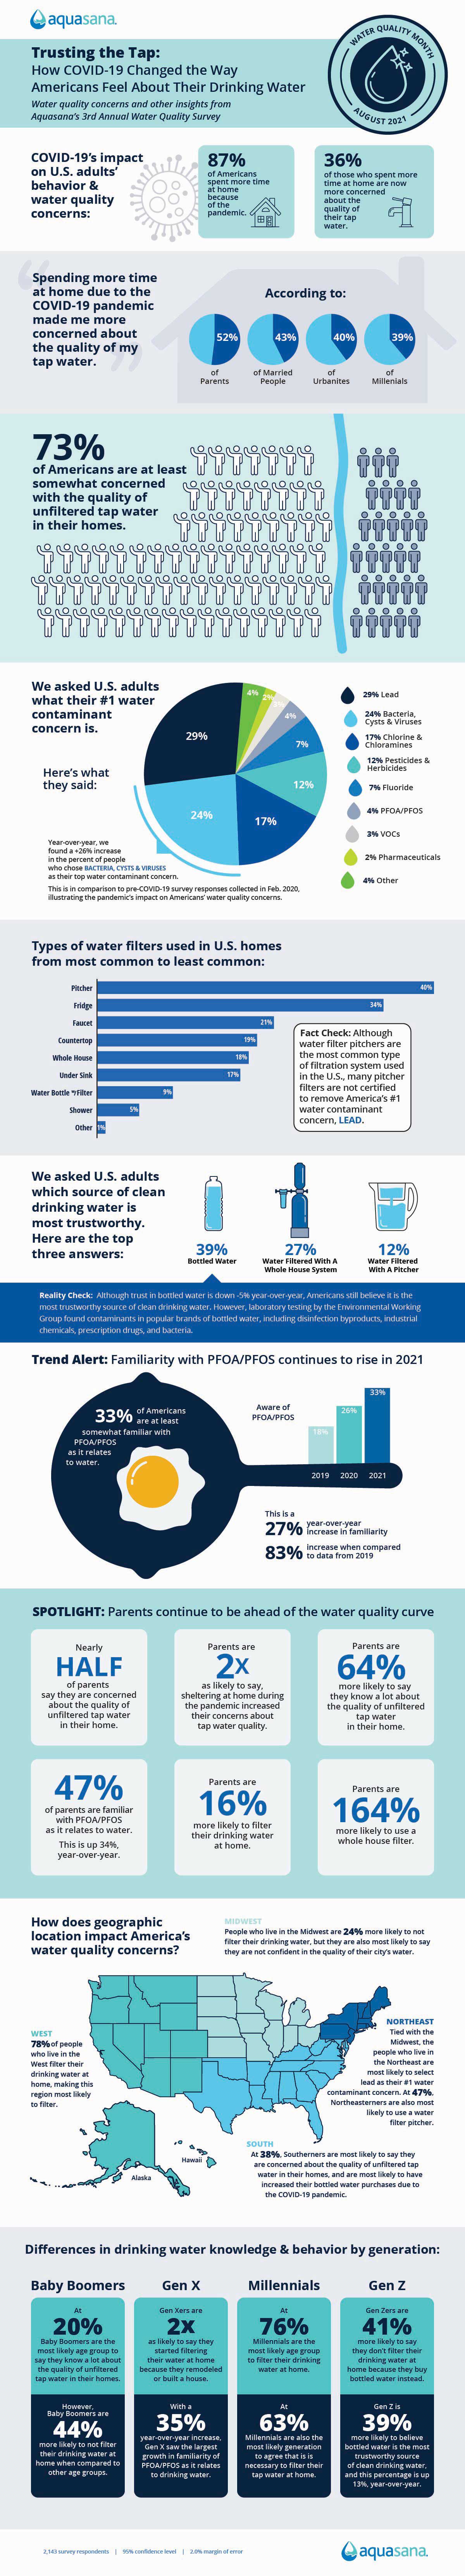
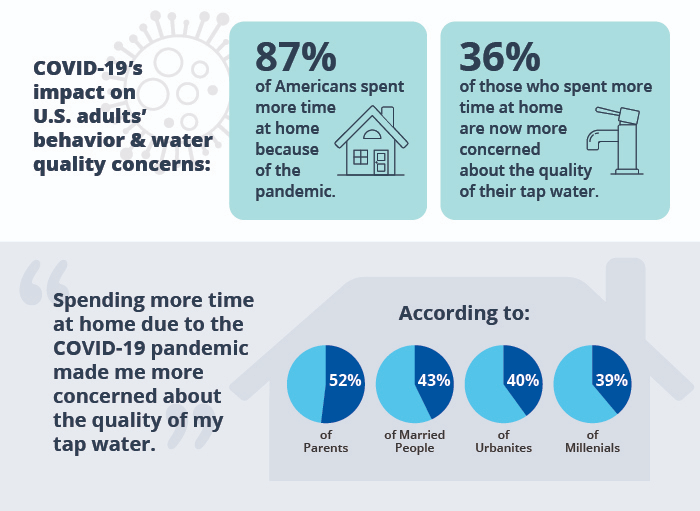
This year, we found COVID-19 had a profound impact on Americans’ behavior and concerns, as people who spent extra time at home throughout the year are now more concerned with their water quality than they were prior to the pandemic. There was also an increase in demand for bottled water, which remained the most trusted source of healthy drinking water even though that trust declined year-over-year.

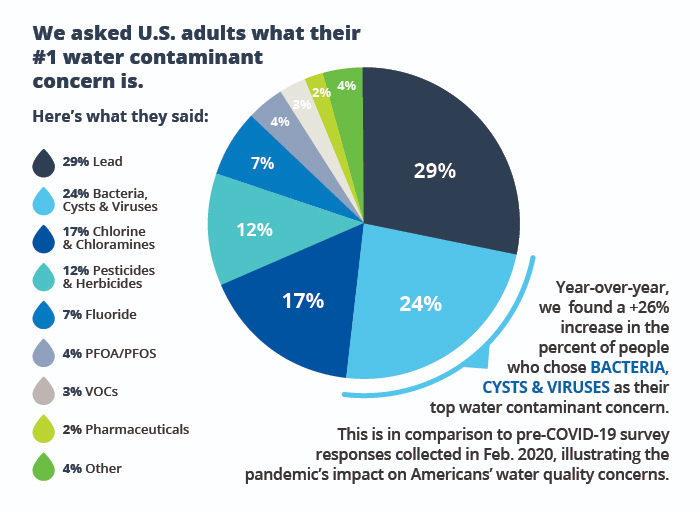
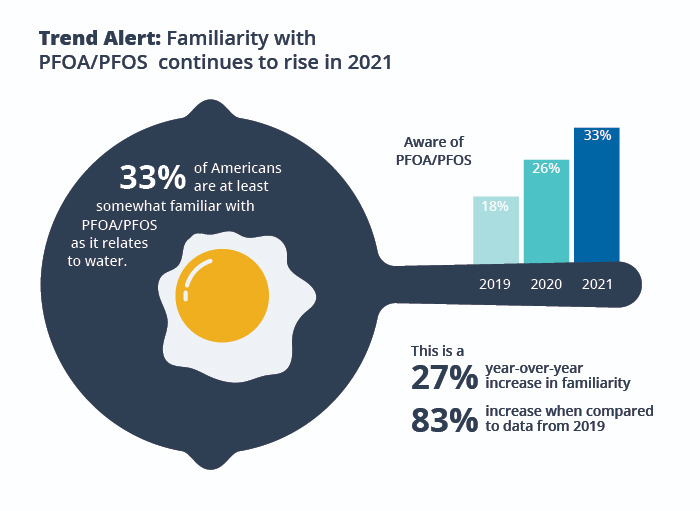
There was also a significant increase in the percent of people who chose bacteria, cysts, and viruses as their number one water contaminant concern, which was likely tied to concern about viruses spreading through drinking water. Awareness for PFOA/PFOS also continues to rise, with Millennials being the most likely generation to rate it as their top water contaminant concern for the second year in a row.

Our new survey data also indicates there is a behavior gap between the top water contaminants that concern Americans and the most commonly used water filters. Many of the most popular types of water filters (pitcher filters and refrigerator filters) aren’t certified to remove people’s top contaminant concerns, such as lead. Furthermore, despite their widespread use — pitcher and refrigerator filters aren’t the most trusted source of drinking water. That honor goes to bottled water, though trust has dropped over the past year.

These are just some of the notable findings from this year’s research. We’ll continue releasing survey findings throughout the rest of 2021 in future posts.

Survey Methodology and Definitions

The findings presented in this article are the result of a March 2021 study of 2,143 U.S. adults, ages 18-79, conducted by Aquasana. (Confidence Level: 95%, Margin of Error: 2%)

Survey definitions 

Age Cohorts (based on Pew Research

  • Baby Boomers: 1946-64
  • Gen X: 1965-80 
  • Millennials: 1981-96
  • Gen Z: 1997-2012

Regions (based on U.S. Census map

  • Northeast: Maine, Massachusetts, New Hampshire, New Jersey, New York, Pennsylvania, Rhode Island, Vermont, Connecticut
  • Midwest: Illinois, Indiana, Iowa, Kansas, Michigan, Minnesota, Missouri, Nebraska, North Dakota, Ohio, South Dakota, Wisconsin
  • South: Alabama, Georgia, Kentucky, Louisiana, Maryland, Mississippi, North Carolina, Oklahoma, South Carolina, Arkansas, Tennessee, Texas, Virginia, West Virginia, Delaware, Florida
  • West: Idaho, Alaska, Montana, Nevada, Arizona, New Mexico, Oregon, Utah, Washington, Wyoming, California, Colorado, Hawaii

Urban, Suburban, and Rural Classifications

  • The urban, suburban, and rural classifications we use are based on the database and definitions from Great Data, which developed their logic using U.S. Census data.
Infographic